
What evidence exists to show that the tax preference has contributed to the achievement of any of these public policy objectives?
The number of renewable energy systems certified by the Department of Revenue (DOR) each year and the number of systems with Made in Washington components has increased. However, this growth is largely due to solar technologies with no increase in wind or anerobic digesters.
In addition, since the credit began, four businesses have had their products certified as Made in Washington and one of those has discontinued its production.
Greater use of locally created renewable energy technologies
There has been an increase in the use of some types of locally created renewable energy technologies since the preference began.
The number of renewable energy systems installed annually by utility customers and community solar project participants has increased nearly five times in the last five years, from 666 in 2011 to 3,151 in 2015. In addition, the average capacity of systems has increased, meaning more power is generated from each system. For residential systems, the average capacity size increased from 4.5 kilowatts in 2011 to 7.1 kilowatts in 2015.
The number of renewable systems installed annually has increased each year since 2011

Source: JLARC staff analysis of DOR system certification application data.
The portion of systems that DOR has certified as “Made in Washington” has also increased each year since 2011. From 2011 through the first quarter of 2016, program participants have installed 59,401 kW (59 megawatts) of capacity. Over three quarters (76 percent) of that capacity is in systems containing components that are certified as Made in Washington.
Systems that are made in Washington make up an increasing share of the total capacity installed each year since 2011

Source: JLARC staff analysis of DOR system certification application data.
The Legislature did not specify a target for the number of renewable energy systems it intends to create or for the amount of energy these systems should produce.
Growth in solar, but no increase in wind or anaerobic digester certifications
The increase in use of locally created renewable energy technologies is attributable to photovoltaic solar panels. These are devices that convert light directly into electricity using semiconductor material. Wind generation systems currently account for only 0.5 percent of systems installed and 0.4 percent of capacity. Unlike solar energy systems, the number of new wind system certifications has not increased over the time period that the preference has been in effect.
From 2011 through the first quarter of 2016, DOR has certified 199 kW of wind energy system capacity. No manufacturers have produced blades certified as Made in Washington. Customers using wind energy systems receive a lower payment rate from the utilities as well as a smaller benefit from buying Made in Washington certified components.
(insert table)
Source: JLARC staff analysis of certification application data from DOR.
Since 2011 there have been no new certifications of anaerobic digesters through the program.
2. Support and retain existing local industries and create new opportunities for renewable energy industries to develop in Washington
While the number of new locally made renewable energy system certifications has increased,it is unclear what type or amount of industry growth is expected.
The number of new system installations with Made in Washington components has grown steadily, from 316 in 2011 to 2,813 in 2015. This growth has provided expanded opportunities to Washington businesses in the renewable energy industry.
However, these opportunities have been almost entirely in solar energy systems, and concentrated in a small number of businesses.
Since the preference was enacted, four businesses have had their products certified as Made in Washington by the Department of Revenue.
- In 2010, Silicon Energy LLC became the first solar panel manufacturer to make Made in Washington certified modules. It has since discontinued its Made in Washington modules.
- In 2011, Itek Energy gained certification for its solar panels and OutBack Power gained certification for its inverters.
- In 2012, Samson Solar gained certification for its inverters.
No new manufacturers have gained certification since 2012, and there are no certified businesses for wind energy systems
To what extent will continuation of the tax preference contribute to these public policy objectives?
Continuation of the preference would mean utilities could continue to receive tax credits for payments they make to customers producing renewable energy. However, it is not clear to what extent these credits would continue to encourage new installations of renewable energy technology.
Utilities may claim up to $100,000 or 0.5 percent (whichever is greater) of their taxable sales of power each year as a credit. As of April 2016, at least 14 of the 39 participating utilities have announced to customers that they have already reached their caps or expect to within the next year. Of these 14 utilities,
- Eight utilities have closed their programs to new applicants to preserve the incentive rate for existing participants. In these service areas, continuation of the program is not likely to contribute to the public policy objectives.
- Six other utilities are proportionally reducing the amount of the incentive to each customer and continuing to allow new applicants. Some utilities expect to reduce payment rates to customers up to 33 percent for Fiscal Year 2016.
The exhibit below shows the service areas of utilities that expect to reach their caps in 2016. Territories shaded gray are still open to new applicants and are reducing the payment rate to each participant. Territories shaded orange are closed to new applicants.
Eight utilities have closed programs to new participants and six utilities will make reduced payments to qualifying customers
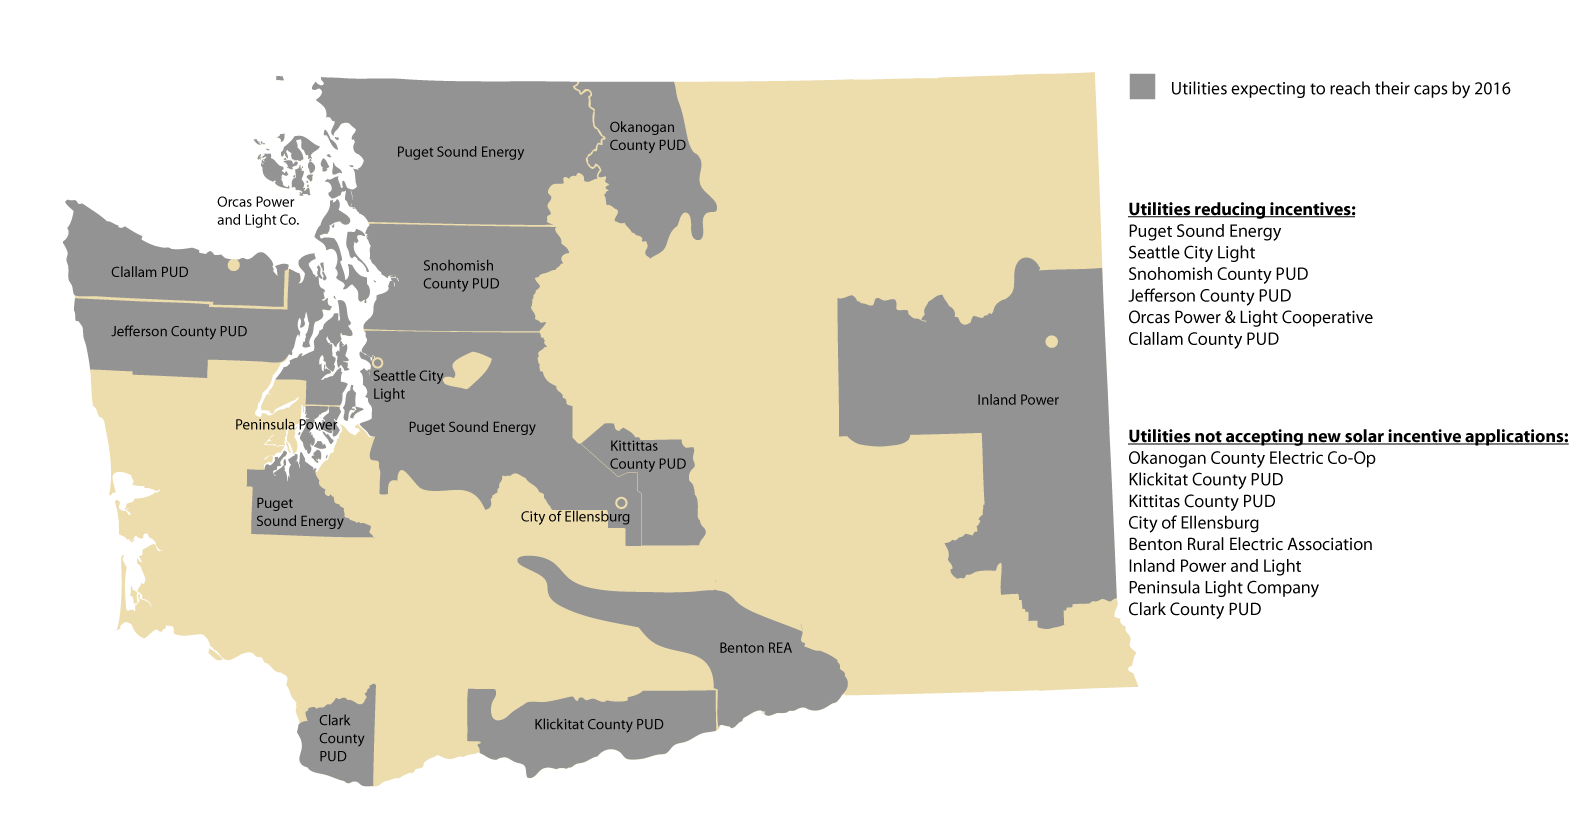
Note: some service areas shown may overlap with other utilities.Source: JLARC staff analysis of information provided by the WSU Extension Energy Program and utility documents.
It is unknown what effect these reductions will have on new renewable energy system installations as the program continues. The first quarter of 2016 was the first period since 2011 where fewer systems were installed than the same period one year before. The cause of that decrease is unknown.
The first quarter of 2016 saw the first year over year drop in new system certifications since 2011

Source: JLARC staff analysis of DOR system certification application data.
If the public policy objectives are not being fulfilled, what is the feasibility of modifying the tax preference for adjustment of the tax benefits?
It is possible there could be other approaches to encouraging the use of locally created renewable energy technology.
Based on the capacity installed from 2011 through the first quarter of 2016, the average incentive rate is about 45 cents per kilowatt hour of electricity generated by customers using their own renewable energy systems. This rate may vary in the future depending on what types of systems are installed and the number of customers affected by reduced payment rates from utilities nearing their cap.
It is difficult to determine if there is a less expensive alternative for encouraging the production of renewable energy because any incentive program will depend on varying factors, such as how long the incentive program will be in effect, how long the renewable energy systems will be in place, and how many consumers will purchase renewable energy regardless of the incentives offered.

